
Wow. It's been a while since I've posted and I completely apologize for this! As many of you may or may not know, finishing up graduate school isn't easy and the time seems to just fly by. So much has happened since my last blog post - I've finished my geological map, created line-balanced geological cross-sections, analyzed geochemical and geophysical datasets, and successfully defended my Master's research! Woa!
Here is the citable link to my final thesis titled: Kinematics of the Columbia Hills Anticline and the Warwick Strike-Slip Fault, Yakima Fold and Thrust Belt, Washington, USA - if you are interested. I'll begin with the geological map results.
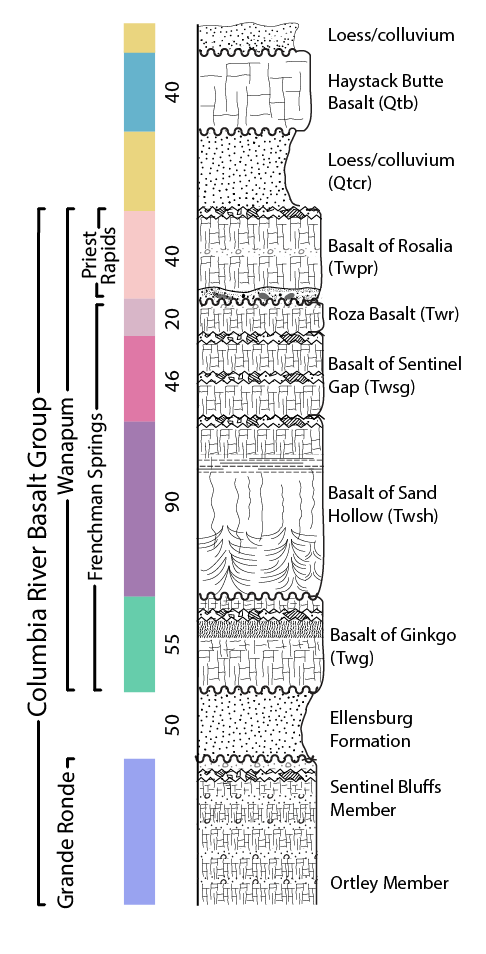
Above is the stratigraphic column of the rocks in my map area. Use the color bar to the left of the column to help you identify and correlate the map units to those you see on my geological map. As I mentioned in previous blog posts, the majority of the map units (the pink, purple, and teal color rocks) are Columbia River Basalt flows from the Wanapum and Grande Ronde Formations. Below is my final geological map. Very exciting!
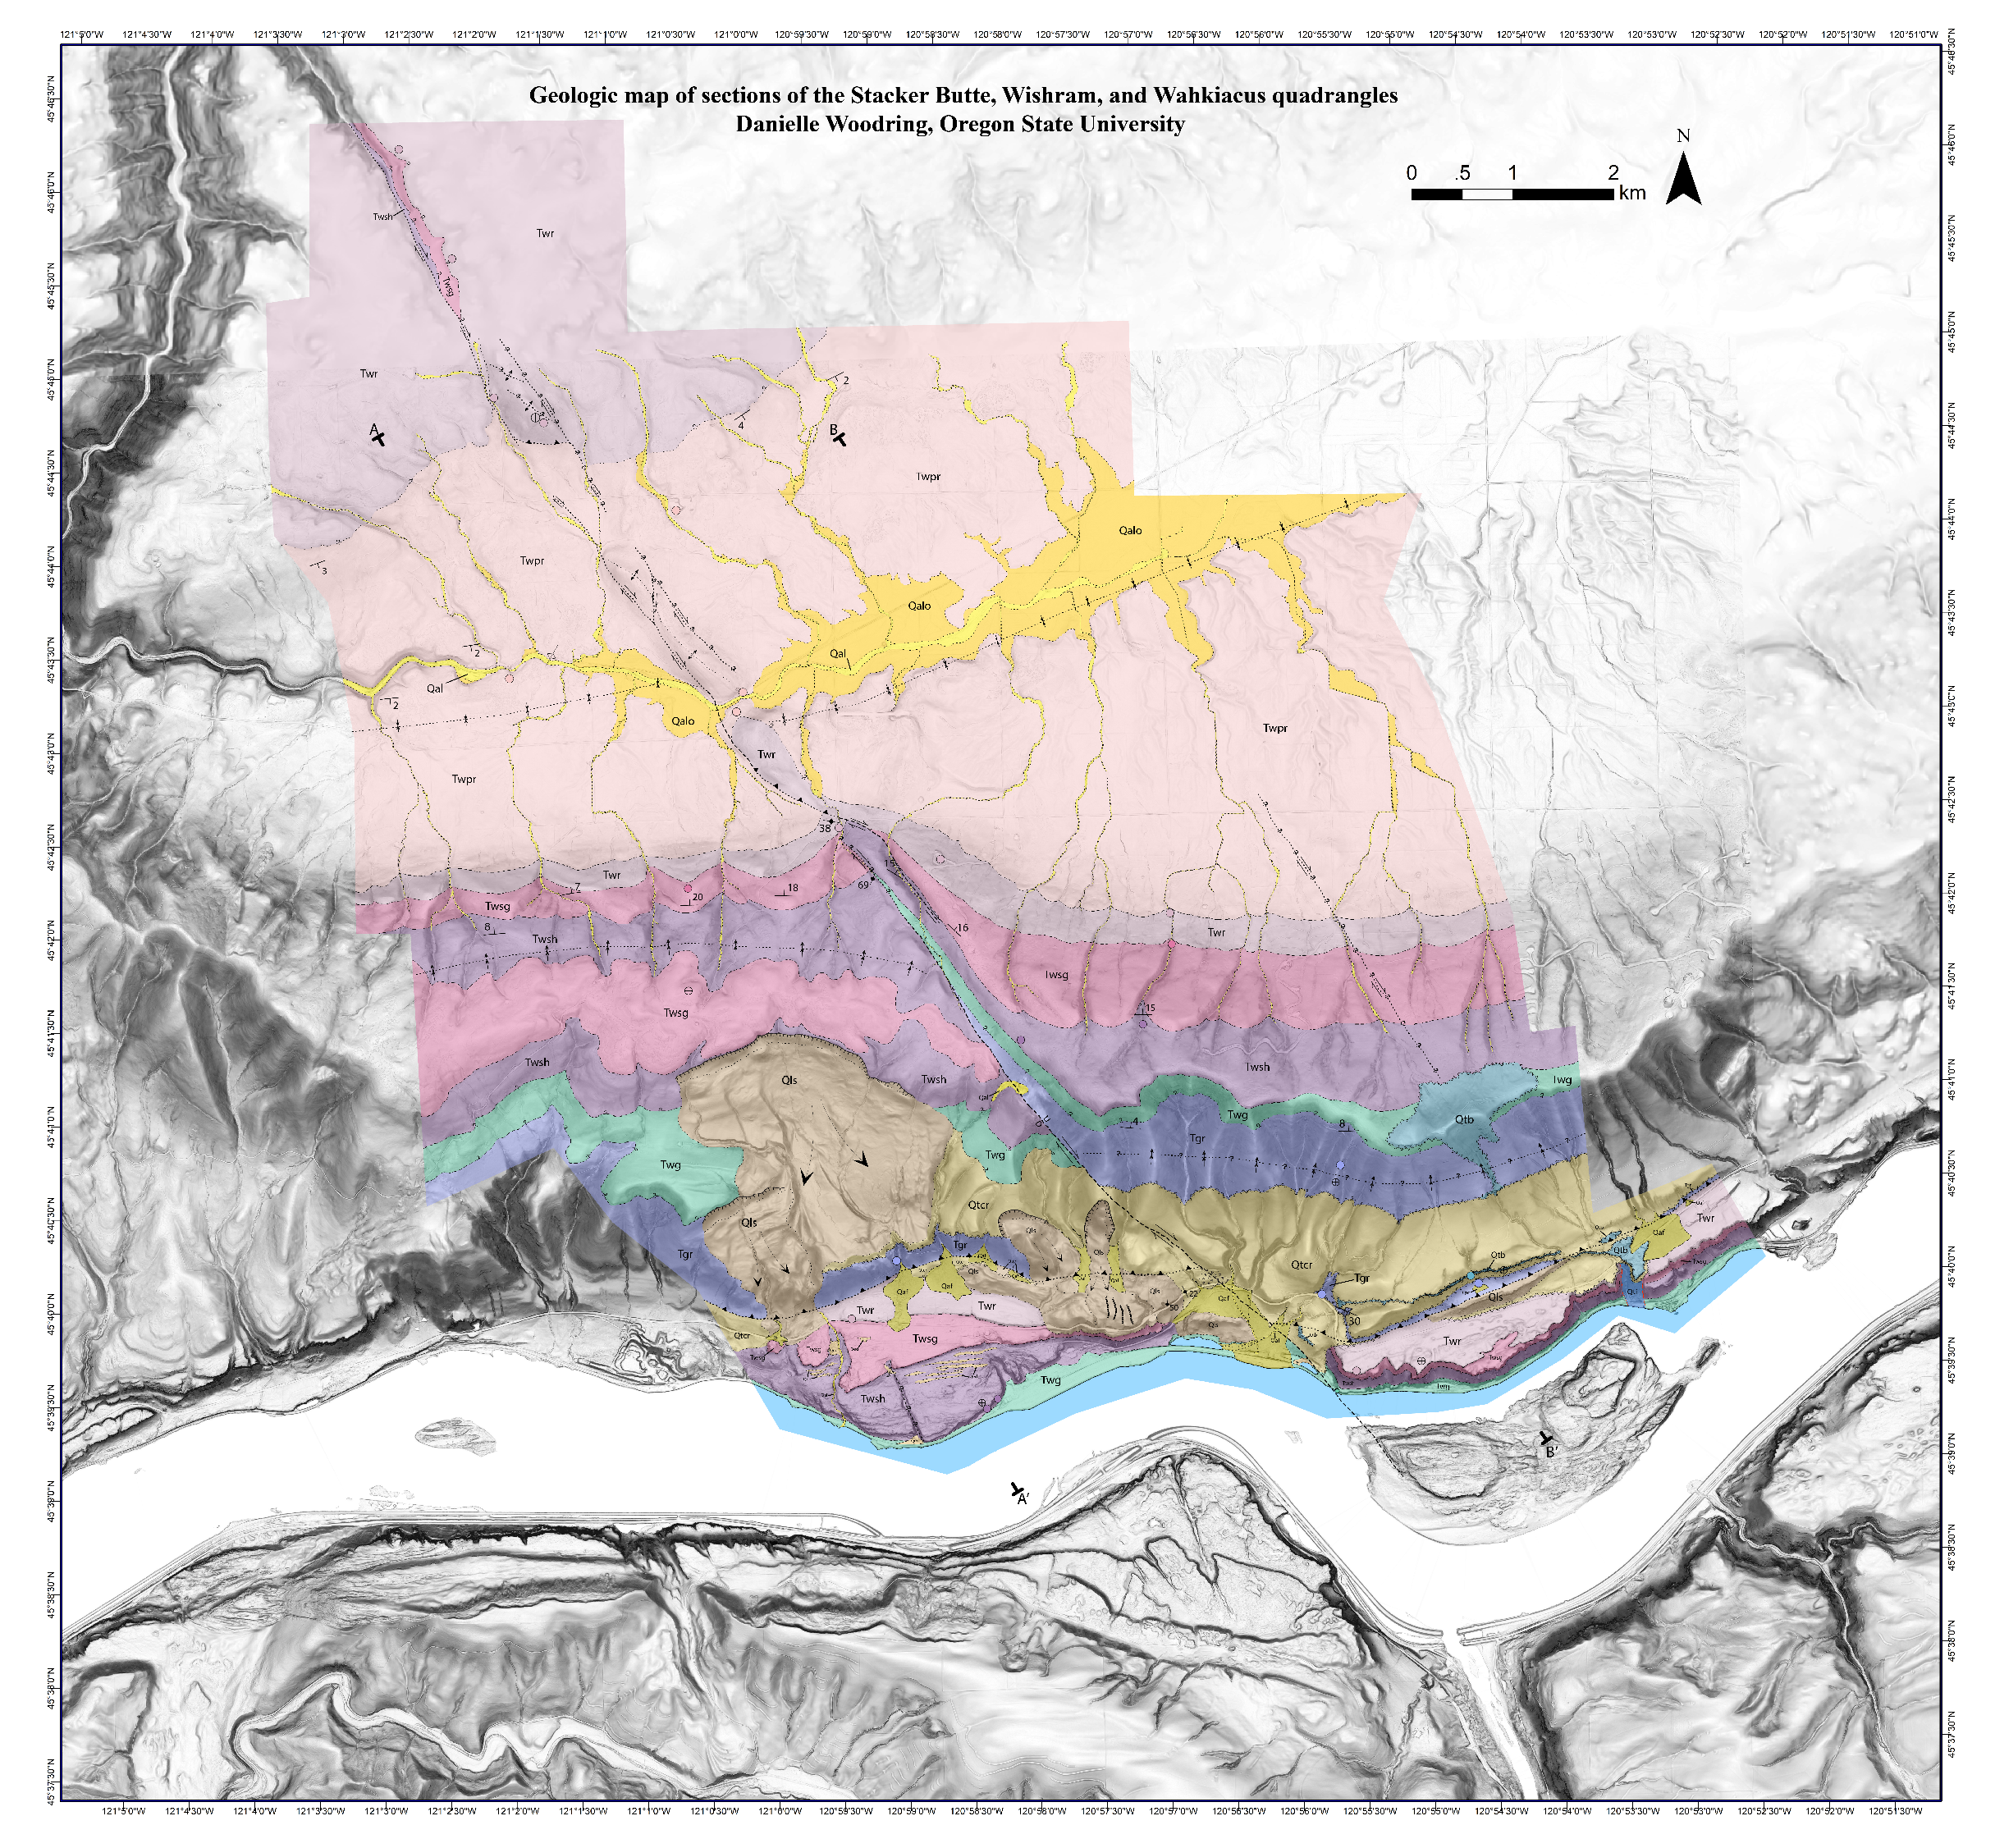
The map area is composed of three major compressional structures, the Columbia Hills anticline, Columbia Hills thrust fault, and the Swale Creek Valley syncline, and one major strike-slip structure, the Warwick Fault. The Columbia Hills anticline is a south-verging fold extending more than 150-km east from The Dalles, Oregon into southern Washington state. The fold is cored by the Columbia Hills thrust fault, which daylights on the south side of the fold. The Warwick Fault Zone is a NNW-SSE trending right-lateral strike-slip fault zone that separates the CHA into western and eastern fold segments. North of the CHA, is the Swale Creek Valley syncline, a broad NE-SW trending fold.
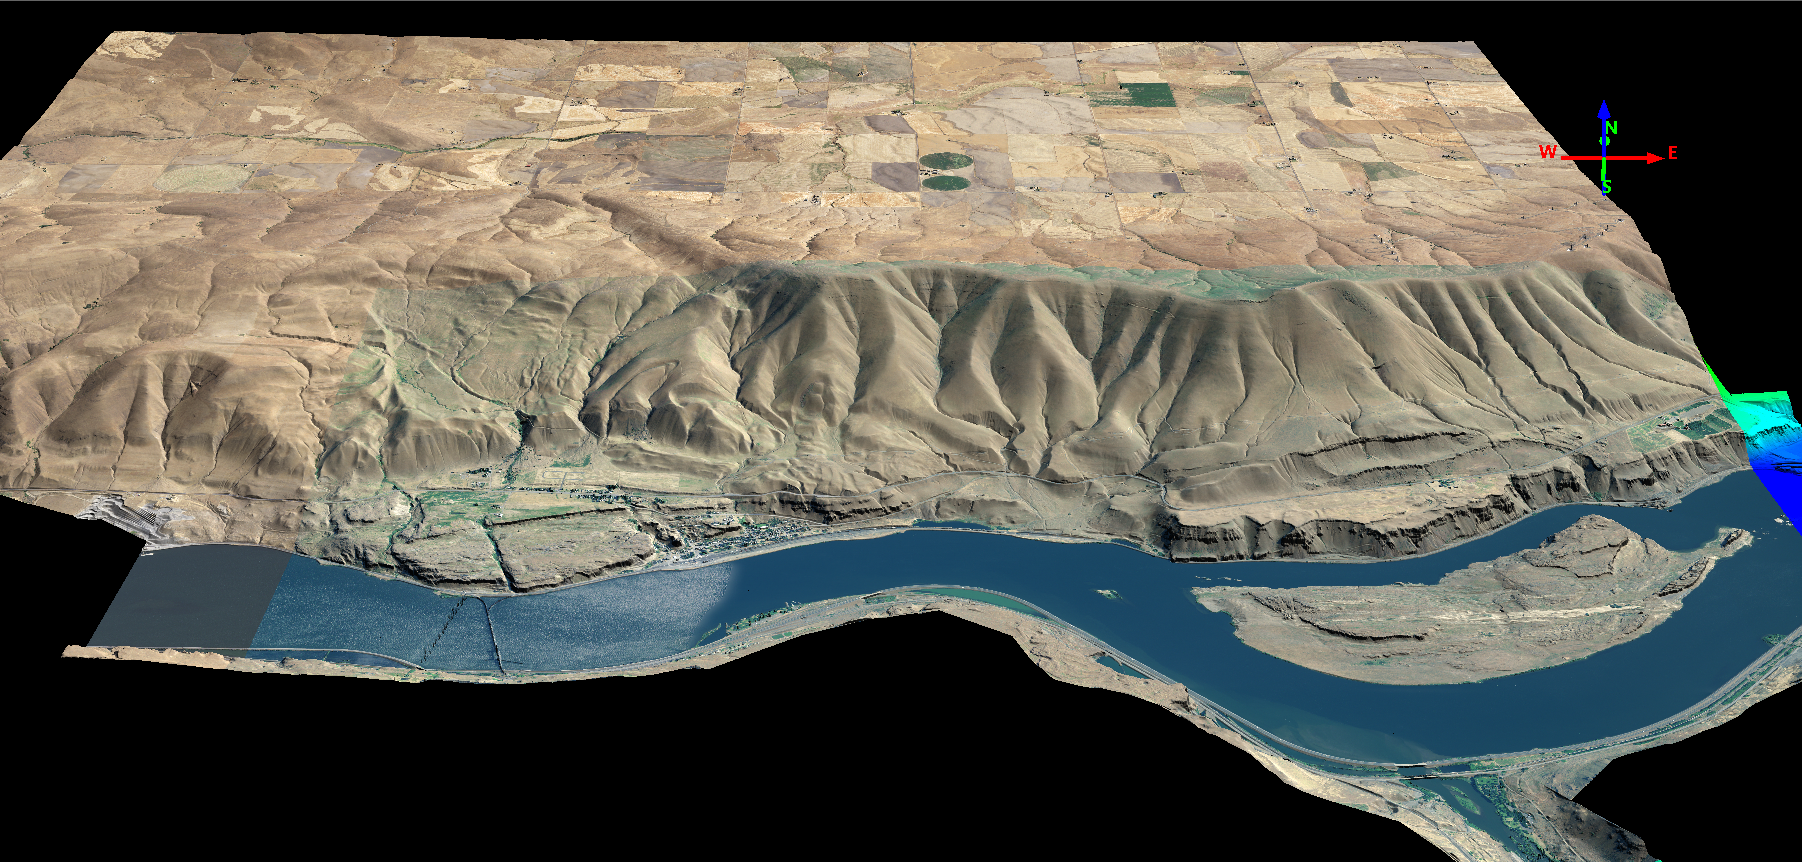
I'll be the first to admit that finishing up this map was definitely not easy, although overcoming each challenge has made me gain valuable new experience in the field of geologic mapping! Many essential tools and people helped me along the way. One of the most important, in regards to helping me finish my final map was geochemistry! I collected chemical samples of many of the basalt flows in my area to essentially chemically fingerprint each flow. This really helped me finish my map, as many of you may know….it's not easy discriminating CRB flows. Geospatial visualization software programs were also key to my final map product. I used the software package Quick Terrain Modeler to help me figure out the dip of the CRB flows on the flanks of the anticline. Something that was essentially impossible to do in the field. Below is a cool QT Modeler 3D image of my map area looking north across the Columbia River.
After I completed my geologic map, I conducted structural analyses of the area to learn more about the timing of movement on the structures I listed earlier in this post. I won't go into those details now, so stay tuned for my next post! Spoiler alert - we actually learned that the large, NW-trending strike-slip fault is an active fault, meaning that it's moved in the recent geological past and should be considered in the future when assessing the seismic hazards in the area. In my next post I'll describe more about this and include the results of my seismic hazard assessment.
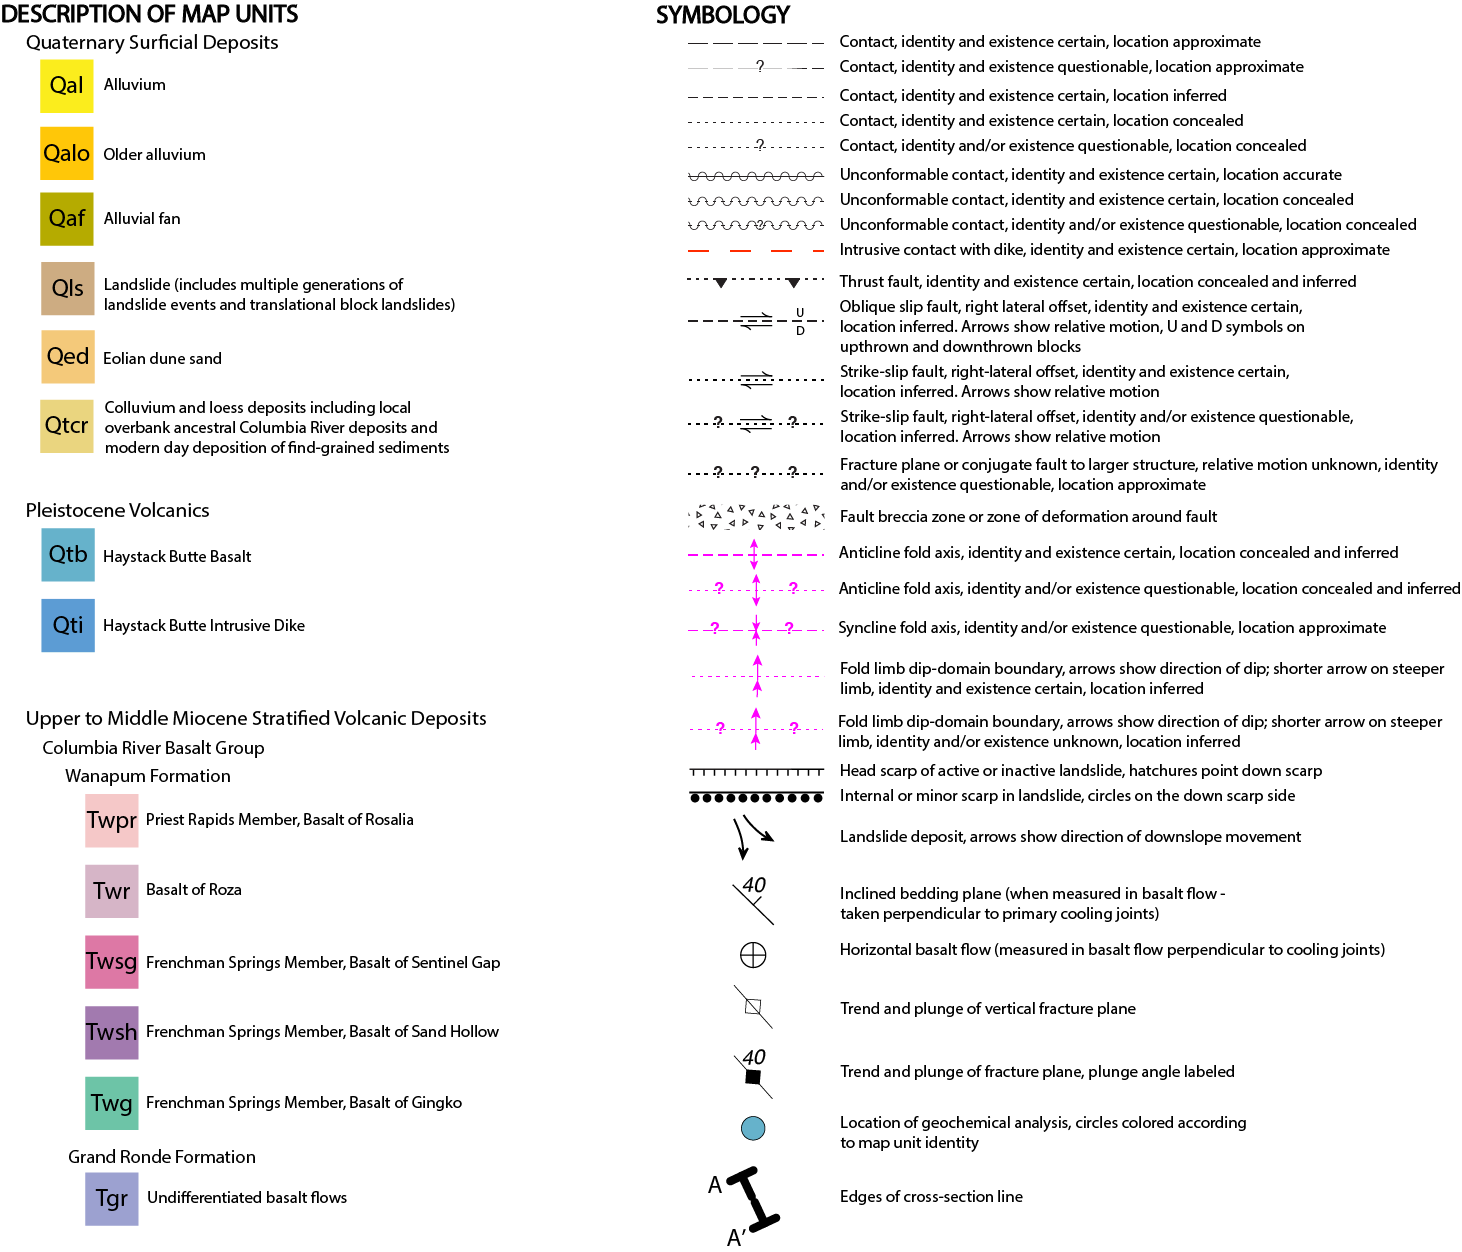
Above is the more detailed key to the geological map - in case you are more curious!
Post written and edited by Danielle Woodring, 2020-06-10